Introduction
The attitude of an individual towards another race or ethnicity is deeply rooted and rarely reported. Implicit Association Test (IAT) assesses perceptions and beliefs that human beings might dislike or are incapable of saying (Harvard University, 2011; Schimmack, 2021, p. 396). Interestingly, IAT helps people be conscious of the various implicit attitudes. However, research shows that IAT can exacerbate ethnic profiling among its participants (Hussey and De Houwer, 2018, p. 1). IAT is applicable in testing people’s perception of other people’s race and ethnicity while unearthing the various attitudes one has towards others. IAT has made it possible for researchers to identify multiple biasedness attributes on gays, races, obese people, and the physically disabled (BBC, 2017). For this paper’s purpose, the IAT focuses on how people implicitly associate those from other ethnicities with positive or negative characteristics. IAT focuses on the inherent bias entrenched in an individual’s mindset by measuring the relationship between concepts and evaluations.
The given IAT summarizes more than 3million racial scores carried out between 2002 and 2015. The IAT score shows that 68% of the respondents preferred European Americans to African Americans (Author, year, Page). On the other hand, 14% of the respondents chose African Americans to European Americans. Only 18% of the participants had no preference between European Americans or Black Americans. Implicit stereotyping is detrimental as it is evident during the administration of specific healthcare, employment opportunities, and law enforcement in society. The IAT scores show that people associate good things with Whites while associating Blacks with awful stuff from the sample.
From the given IAT scores, most interviewees could quickly sort words when European Americans were tied to a “Good” button than if African Americans were tied to the “Good” share button. People usually have a quick response when a closely associated parameter in their mind uses the same button with a perceived attribute. Therefore, the given IAT results are congruent to the existing studies stating that most people prefer Whites to Blacks based on their current good or wrong perceptions.
Main Discussion
Abstract
IAT has significantly become one of the most famous psychology theories that attempts to predict ethnic profiling. Ethnicity favoritism has been evident in different areas such as healthcare, law enforcement, and schooling. IAT data was vital in the study on the impact of the low self-reported racial preference on how one feels towards each ethnic group. A sample size of 101 respondents was studied, whereby the measurement of racial descriptor was on a scale of five while that of warm perception was on a scale of -10 (coldest) to +10(warmest). Sixty-one of the respondents were females, and forty were males, with the samples drawn from five different racial groups. Regression analysis on the study showed that warm treatment and racial preference exhibited a correlation of 22.8%. Based on the ANOVA test, the model had a p-value of 0.002<0.05. The study established that low self-reported racial preference directly affects how warmly one feels on an individual from a particular group.
Introduction
IAT scores emanate from the difference between the stereotype congruent condition and the stereotype non-congruent condition. Minority races are associated with bad attributes such as ugly, carelessness, primitive, violence, and so forth. According to Williamson, Trump, and Einstein (2018, p. 400), racism contributes to police brutality. People base their attitudes towards others based on their skin color. For instance, some races are mainly associated with good attributes such as civilization, etiquette, and many others, while others are not. There is a need to evaluate the available literature on the different perceptions regarding skin color globally. IAT is meant to help researchers predict the prevalence of ethnic and racial profiling in society (Meissner et al., 2018, p. 1). According to Oswald et al. (2015, p. 567), IAT helps researchers predict the plethora of implicit partiality against ethnic and racial minorities. IAT attempts to predict the underlying prejudice on matters of racial and ethnic groupings.
In American society, racism has been in existence for generations owing to moral decadence. Hehman, Flake, and Calanchini (2018) report that due to the lack of adequate data on police brutality psychological aspects, racial bias within law enforcers remains a challenge to the ethnic minorities. For instance, Carrega (2020) reports that African Americans have constituted at least 49% of unjust convictions since 1989. According to The Guardian (2021), a former FBI unearthed various connections between the serving law enforcers and the racist militant operations in at least twelve states in the US. White supremacists and cohorts propagate ethnic profiling by giving more reverence to the Whites while despising those of different skin color. Ethnic profiling is a rot that is evident everywhere, even within law enforcement agencies. The study will assess the effect of underlying stereotypes using the already given IAT data. Descriptive research will be employed due to its suitability in establishing central tendencies in the research variables.
Hypothesis
The study’s null hypothesis will be: Low self-reported racial preference does not impact how warmly one feels towards an individual from a particular racial group. The study’s alternative hypothesis will be: The low self-reported racial bias significantly affects how warmly one feels towards an individual from a specific racial group.
Methodology
This section will focus on different aspects of the research. According to Harris (2008), the subsections will include design, participants, apparatus, and procedure. This part gives a detailed elucidation of what was done during the study coherently, clearly, and precisely.
Research Design
Researchers have different ways of carrying out experiments in psychology. Research design encompasses how conditions are arranged, participants used, and potentially confounding variables controlled (Harris, 2008, p. 32). This study’s independent research variable is low self-reported racial preference measured on a 1 to 5 scale. Racial descriptor was as follows: 1= “Black or African American,” 2= “Asian,” 3= “Caucasian,” 4= “Hispanic,” and 5= “Indian” (Author, Year, Page). This study’s dependable variable is the level of warm perception towards a group measured on a -10 (coldest) to +10 (warmest) scale.
Participants in the Research
There is a need to describe the critical features of the sample in the study. According to Harry (2008, p. 34), research participants are people from whom the researcher attains data. In the research, there were 101 participants, whereby 61 were females and 40 males. The sample was drawn from different racial groups. Blacks or African Americans were 12, Asians 30, Caucasian 32, Hispanic 10, and Indians 17 in the study. None of the participants was acquainted with the experimenters.
Apparatus Used in the Research
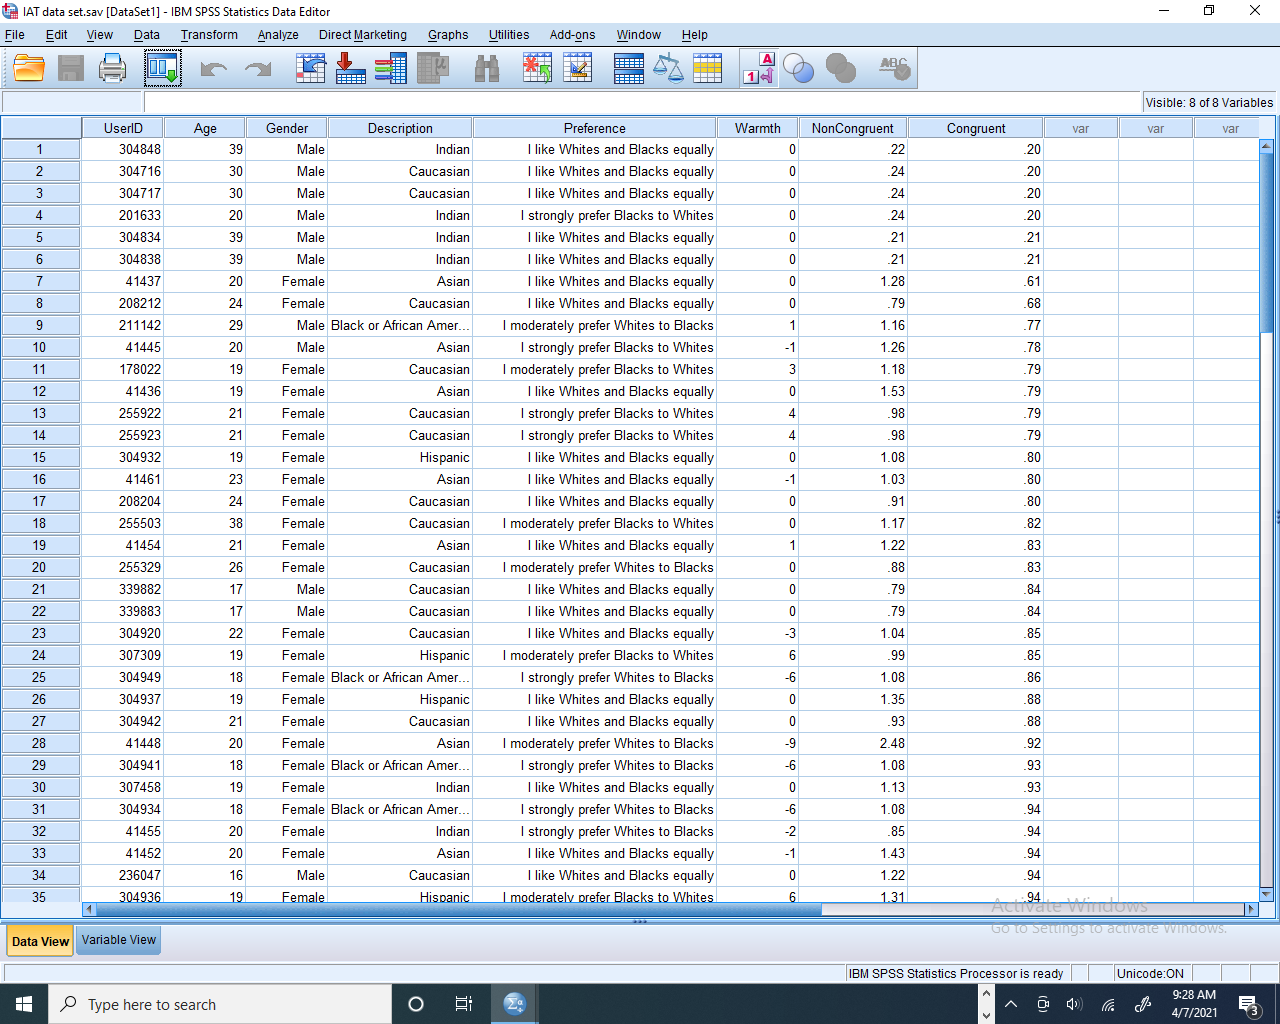
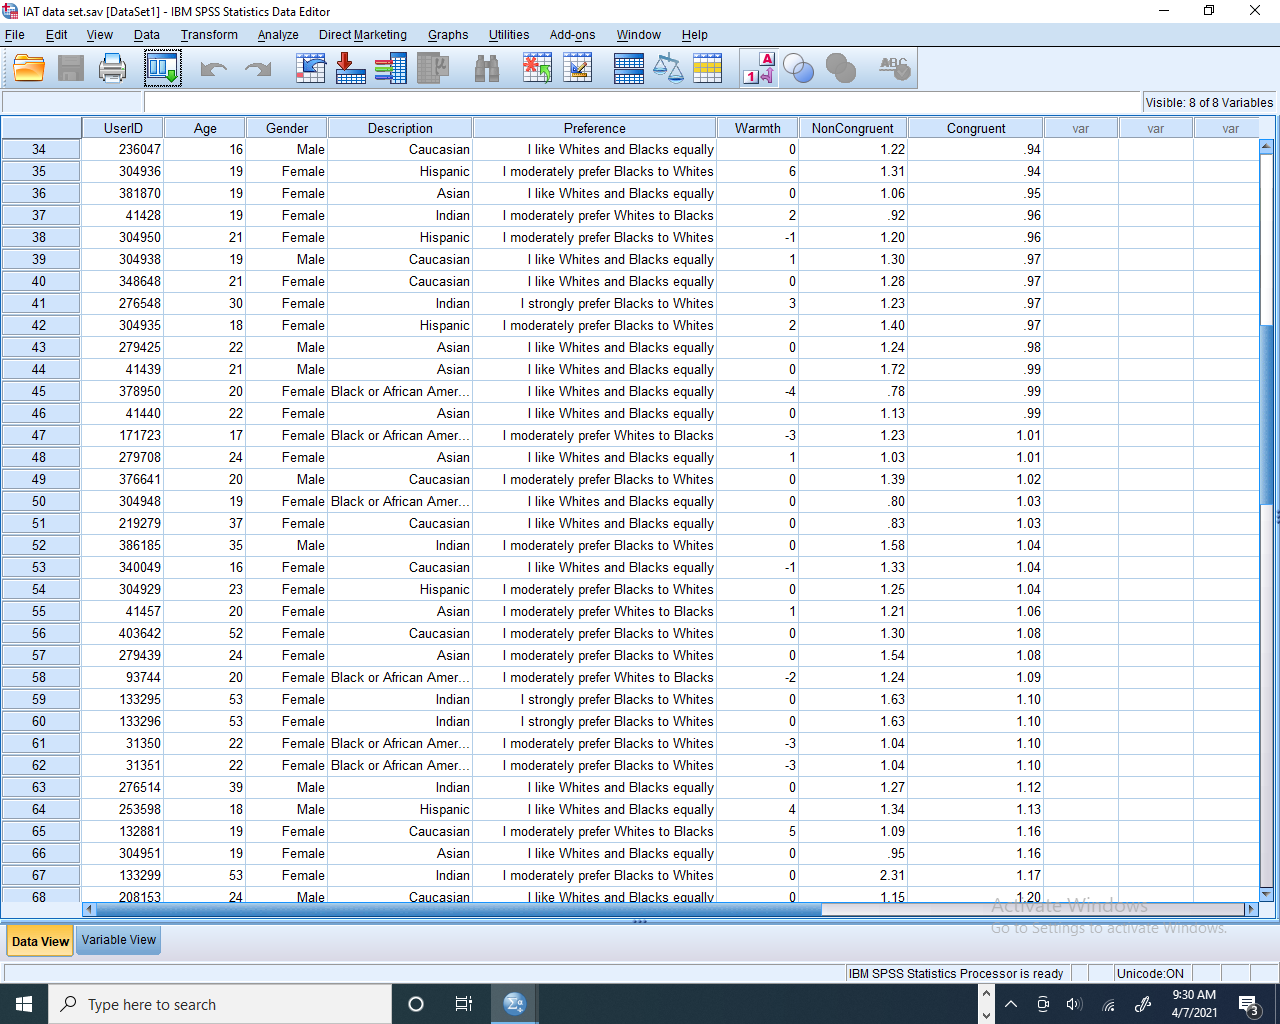
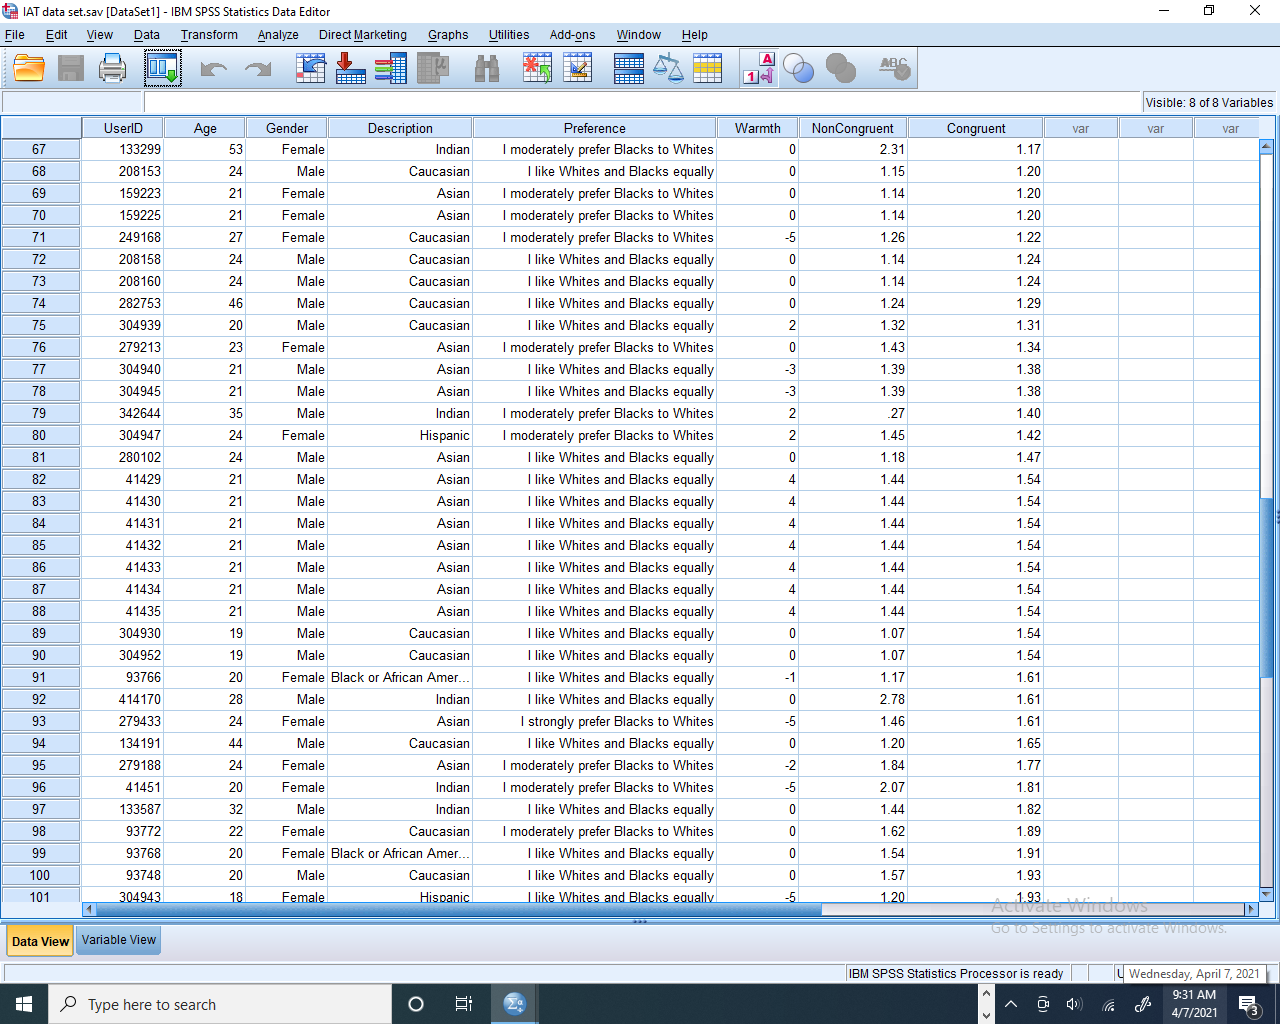
The amount of materials used varies from one research to another, whereby some might only need just a pen and paper. According to Harry (2008, p. 39), a study’s procedure attempts to respond to what was applicable and in what manner. This subsection gives a clear, thorough, and accurate description of the simple nature and layout of all the materials and equipment used in the study. The study is based on IAT data extracted, under ethical consent, from the American Psychological Association (APA) online laboratory. The data was in the form of an SPSS file format.
The Procedure of the Research
This subsection does not focus on the research’s broad strategies but what happened precisely to the participants throughout the study. According to Harry (2008, p. 39), a study’s procedure gives a detailed chronological account of what the researcher said and did to the participants. IAT randomly selected and arranged the combined tasks to minimize the order from affecting the respondents’ total scores. In this section, randomization is explained to convince the reader that the process was done through randomization.
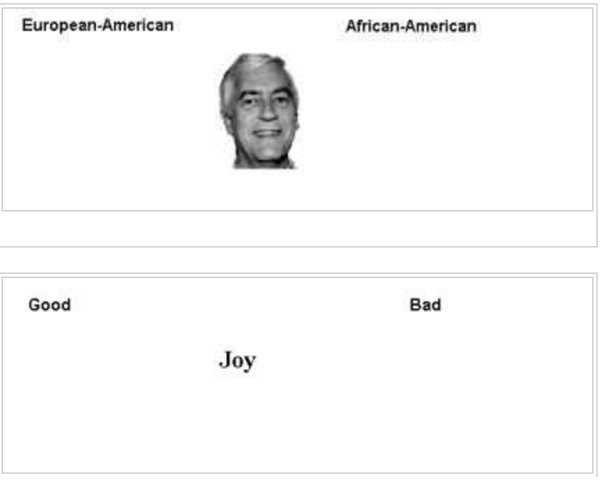
The participants were required to participate in two different activities. The respondents were required to categorize the pictures or words presented to them in the two tasks. Using one key (either 1 or 2), the participants made their face categorizations based on the photos’ racial characteristics, as shown below.
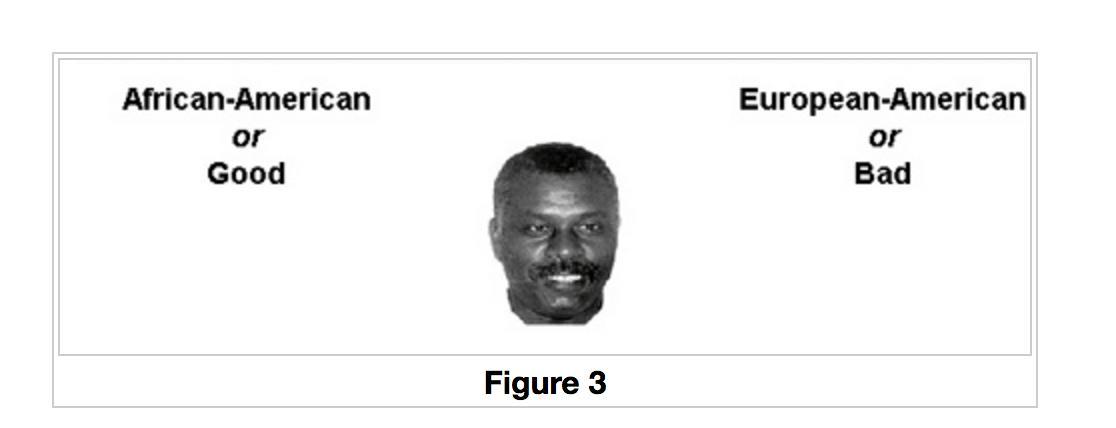
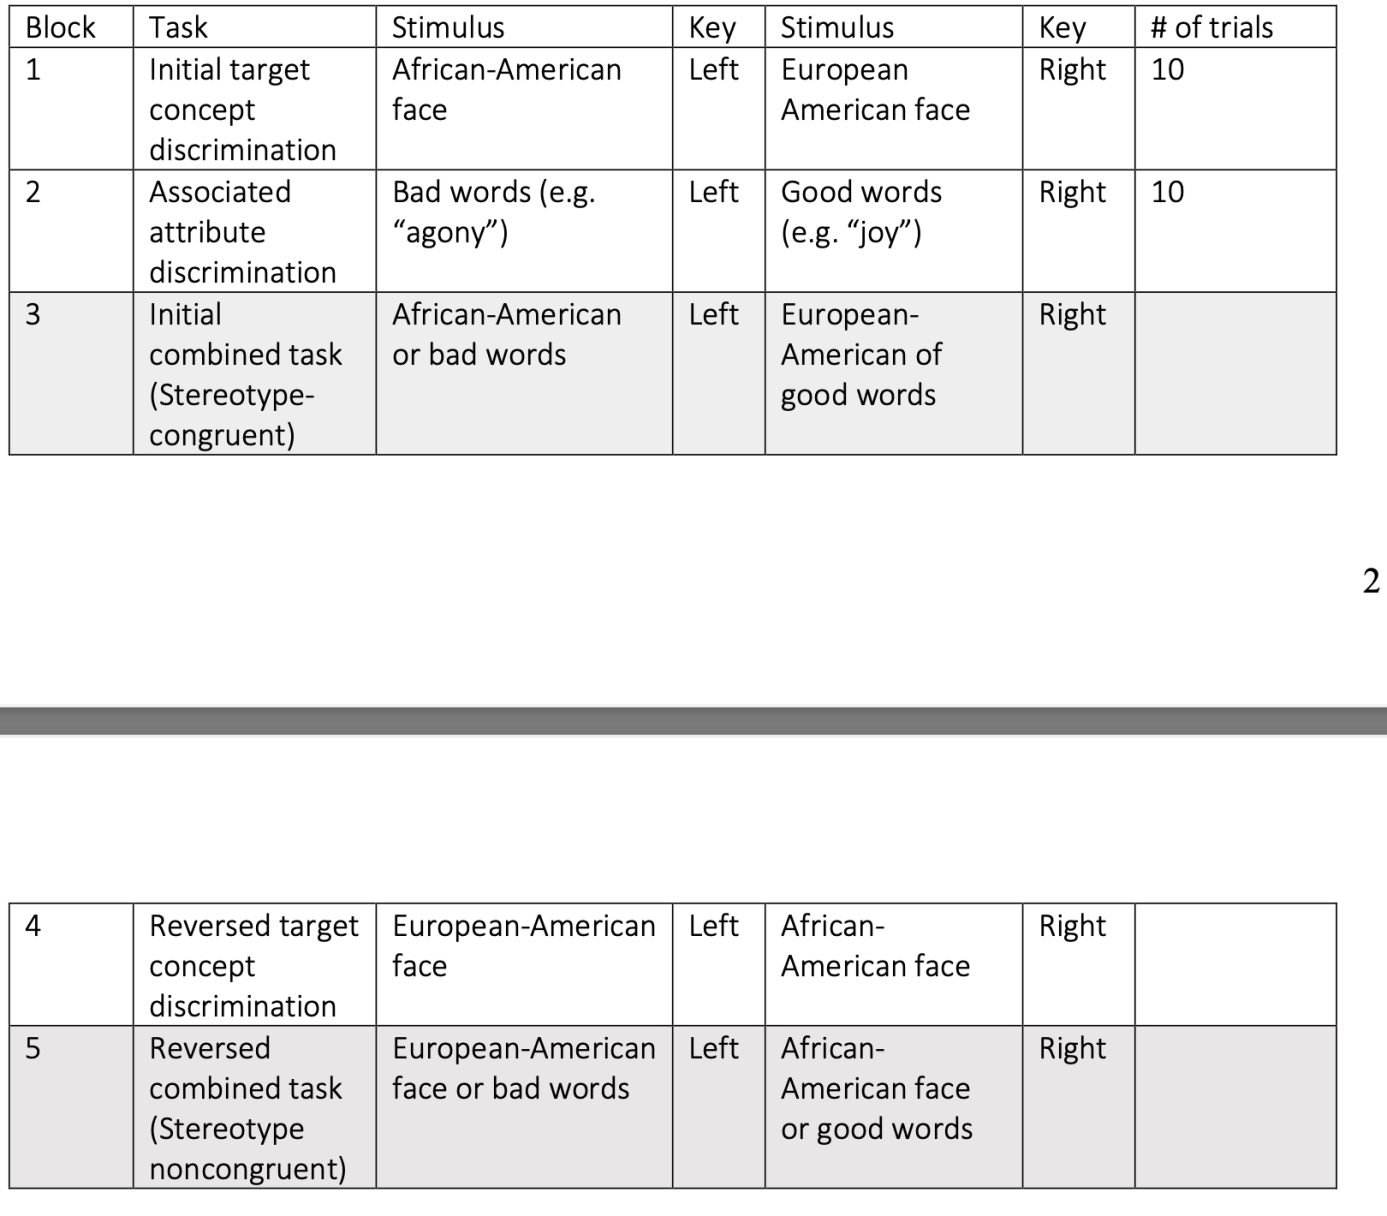
Using the same criterion, the participants also classified words based on “good” or “bad,” as presented in Appendix 1 and Appendix 2. Then, the participants organized photographs or stimulus using a particular phrase such as “is the individual in the photo an African American” or “is the implication of the adjective good” or “is the individual in the photo a European American” or “does the adjective suggest bad.” For instance, if a photograph was offered as a stimulus, the respondents had to decide whether to categorize the photograph as either European American or Bad or African American or Good. The demonstration encompassing five blocks of attempts is shown in Appendix 3.
Results, Analysis and Interpretation
This section entails a report of the findings of the study. According to Howitt and Cramer (2017, p. 102), the results section delves mainly on the research data findings. The report of the outcomes must be without any conjecture on their implications. Additionally, Harry (2008, p. 49) points that there is a need to describe the collected data for quantitative data analysis. Then one must give an account of the types and results of the statistical analysis done on the data mentioned above. The study results were in the form of SPSS screenshots shown in Appendix 4.
Demographic Results
General information during this research was organized into two parts: the gender and race of the participants.
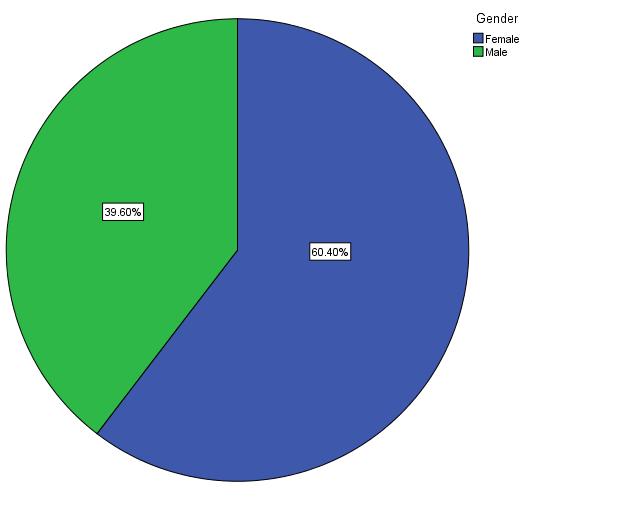
Gender
This part of the research sought to establish the gender of the participants. The researcher profiled the number of males and females who participated in the study. The findings were as represented in the pie chart in Appendix 7. The chart shows that 60.4% of the participants were females while 29.6% were males. The findings imply that the distribution of the participants, in terms of gender, was not even.
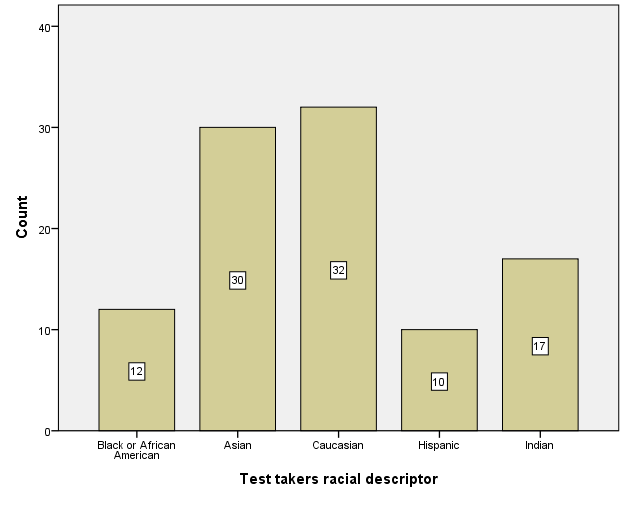
Race
This part of the research sought to establish the different racial representations of the respondents. The results are shown in Appendix 8. The graph shows that out of the 101 respondents in the research were Caucasians (32), Asians (30), Indians (17), Blacks or African Americans (12), and Hispanics (10). The research findings imply that the respondents did not have an even distribution in terms of racial representations.
Racial Representation and Warmth Treatment
The study’s main objective is to establish how low self-reported racial preference impacts how warmly one feels towards people from a particular ethnic group.
Regression Analysis
In the quest to respond to the research question, a simple regression model was applicable. In this study, the independent variable was identified as a racial preference, and the dependent variable was the warm treatment towards an individual from a particular group.
Y=a +bX
Whereby Y= Warm treatment (dependent variable)
X= Racial preference (independent variable)
a and b = Model coefficients
The results in Appendix 9 show that warm treatment and racial preference exhibit a correlation of 22.8%. For this case, it is clear that there is a positive and significant relationship between racial preference (independent variable) and warm treatment (dependent variable).
The table below shows a summary of the model (racial preference on warm treatment)
The table above shows that the relationship has an R square value of 0.052. The R square value mentioned earlier means that the model explains 5.2% of the independent variable’s total variance. Therefore, this implies that other factors not studied result in the remaining 94.8% of the dependent variable variation.
ANOVA (Analysis of Variance): The relationship between racial preference and warm treatment.
The analysis was to establish whether there is any relationship between racial preference and warm treatment. Appendix 10 shows an analysis of variance results for the model on racial preference (independent variable) and warm treatment (dependent variable). The results show that the model has a p-value of 0.002<0.05. The above p-value indicates that the model is statistically significant to establish the positive relationship between racial preference and warm treatment.
From the above results, we reject the null hypothesis in favor of its alternative, which states that low self-reported racial preference impacts how warmly one feels towards people from a particular racial group. Consequently, there is a statistically significant relationship between low self-reported racial bias and how one feels towards people from a specific racial group.
Discussion
Human beings are social and coexist with each other regardless of their different ethnic backgrounds. The research findings are clear that an individuals’ attitude towards people from a certain race directly influences the warmness towards the particular race. The participants were compelled by their racial preference on how they treated others based on their ethnicities (with a mean square of 27.554 and p-value of 0.002<0.05). Eventually, this means that individual racial preference positively correlates with the warmness one has for people from a particular race.
If a teacher has a positive attitude towards a particular race, there are high chances of having a warm attitude towards students from the specific race. In support of the research findings, Kaiser, Südkamp, and Möller (2017, p. 871) state that besides the students’ academic performance, ethnicity and minority status play a notable role in teachers’ judgment. Additionally, students from negatively stereotyped social groups are disadvantaged in such a learning environment (Bonefeld and Dickhäuser, 2018; Holder and Kessels, 2017, p. 471; Yeager et al., 2017, p. 658). Brantingham, Valasik, and Mohler (2018) agree with the research findings by reporting that there is a concern that police patrols aim at harassing the minority communities through predictive policing and motor vehicle racial profiling. Law enforcers are racially biased when executing their mandate, whereby they are ever lenient to those they positively associate with and inhuman to the rest.
Racial profiling is also exacerbating disparities in medical care service delivery among minority or immigrant groups. One presumes healthcare workers perform their duties professionally, but research has shown that some offer services based on the association between them and their clients (Drewniak, Krones, and Wild, 2017, p. 89; FitzGerald and Hurst, 2017). From a sample (n=5,191) of Afro-Caribbean and African Americans in the US, implicit discrimination was positively linked to all the selected diagnoses in hospitals (Wen et al., 2020, p. 331). Racial profiling is being perpetuated implicitly by health workers while serving their clients.
Recommendations
The study unearthed the essence of an extensive understanding of individual implicit perception about other races. Based on the research findings, the ultimate recommendation is that the respondents’ population can embrace warmness to all people regardless of their racial descend. There is also a need for further research on making IAT more effective so that participants do not become more polarized on ethnic grounds.
Conclusion
The data used in the study was in the form of an SPSS document. The research focuses on the relationship between low self-reported racial preference and how warmly one feels towards people from a particular racial group. The general demographic information in the study was gender and race. There were 61 females and 40 males, with the majority being Caucasians in the study. The simple regression analysis showed that warm treatment and racial preference exhibited a correlation of 22.8%. Based on the ANOVA results, the model’s p-value indicates a positive relationship between friendly treatment and racial bias. Based on the results, the null hypothesis was rejected in favor of the alternative one, which states that; low self-reported racial preference has a significant impact on how warmly one feels towards people from a particular ethnic group. There is also a significant relationship between the independent variable and the dependent variable in this study.
Reference List
BBC. (2017) Implicit bias: Is everyone racist? Web.
Bonefeld, M. and Dickhäuser, O. (2018) “(Biased) Grading of students’ performance: Students’ names, performance level, and implicit attitudes.” Frontiers in Psychology, 9, pp.481. Web.
Brantingham, P.J., Valasik, M. and Mohler, G.O. (2018) “Does predictive policing lead to biased arrests? Results from a randomized controlled trial.” Statistics and Public Policy, 5(1), pp.1-6. Web.
Carrega, C. (2020) ‘Because they can get away with it’: Why African Americans are blamed for crimes they didn’t commit: Experts. Web.
Drewniak, D., Krones, T., and Wild, V. (2017) “Do attitudes and behavior of health care professionals exacerbate health care disparities among immigrant and ethnic minority groups? An integrative literature review.” International Journal of Nursing Studies, 70, pp.89-98.
FitzGerald, C. and Hurst, S. (2017) “Implicit bias in healthcare professionals: a systematic review.” BMC Medical Ethics, 18(1), pp.1-18. Web.
Harris, P. (2008) Designing and reporting experiments in psychology. ProQuest Ebook Central: McGraw-Hill Education.
Harvard University. (2011) Implicit association test. Web.
Hehman, E., Flake, J.K. and Calanchini, J. (2018) “Disproportionate use of lethal force in policing is associated with regional racial biases of residents.” Social Psychological and Personality Science, 9(4), pp.393-401. Web.
Holder, K. and Kessels, U. (2017) “Gender and ethnic stereotypes in student teachers’ judgments: a new look from a shifting standards perspective.” Social Psychology of Education, 20(3), pp.471-490. Web.
Howitt, D. and Cramer, D. (2017) Research Methods in Psychology. UK: Pearson.
Hussey, I. and De Houwer, J., 2018. Completing a race IAT increases implicit racial bias. Ghent: Ghent University.
Kaiser, J., Südkamp, A., and Möller, J. (2017) “The effects of student characteristics on teachers’ judgment accuracy: disentangling ethnicity, minority status, and achievement.” Journal of Educational Psychology, 109(6), 871. Web.
Meissner, F. et al. (2019) “Predicting behavior with implicit measures: disillusioning findings, reasonable explanations, and sophisticated solutions.” Frontiers in Psychology, 10(2483), pp.1-16. Web.
Oswald, F. L., Mitchell, G., Blanton, H., Jaccard, J. and Tetlock, P. E. (2015) “Using the IAT to predict ethnic and racial discrimination: small effect sizes of unknown societal significance.” Journal of Personality and Social Psychology, 108(4), 562–571. Web.
Schimmack, U. (2021) “The implicit aassociation test: a method in search of a construct.” Perspectives on Psychological Science, 16(2), pp.396-414. Web.
The Guardian. (2020) White supremacists and militias have infiltrated police across US, report says. Web.
Wen, J., Aston, J., Liu, X. and Ying, T. (2020) “Effects of misleading media coverage on public health crisis: a case of the 2019 novel coronavirus outbreak in China.” Anatolia, 31(2), pp.331-336. Web.
Williamson, V., Trump, K.S. and Einstein, K.L., 2018. Black lives matter: evidence that police-caused deaths predict protest activity. Perspectives on Politics, 16(2), pp.400-415. Web.
Yeager, D.S. et al. (2017) “Loss of institutional trust among racial and ethnic minority adolescents: a consequence of procedural injustice and a cause of life‐span outcomes.” Child Development, 88(2), pp.658-676. Web.
Appendices