Topic Background and Variables Explanation
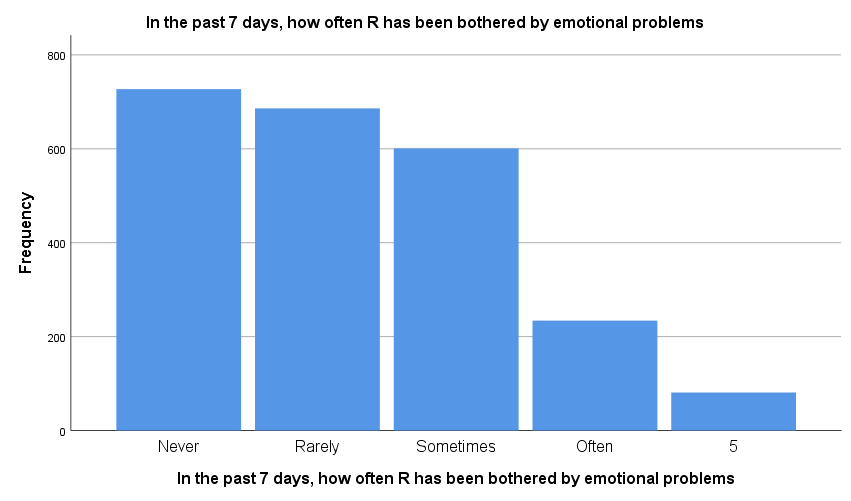
The purpose of the study is to evaluate the frequency, with which participants experience emotional problems, and feelings of inadequate responsibilities their families demand to fulfill. The first survey questions how often the experiments members have been bothered by emotional problems, and answer categories are: never, rarely, sometimes, often, and very often. The total number of valid answers, later presented with the percentage of individuals in each category, excluding the missing data, is 2329 (Almquist et al., 2019). The frequency of answers “never” is 727, with a valid percent of 31.2. The response “rarely” was given by 29.2%, while other categories amounted to 25.6%, 10.0%, and 3.4% respectively.
Table 1. Response Frequency Table for Emotional Problem Survey
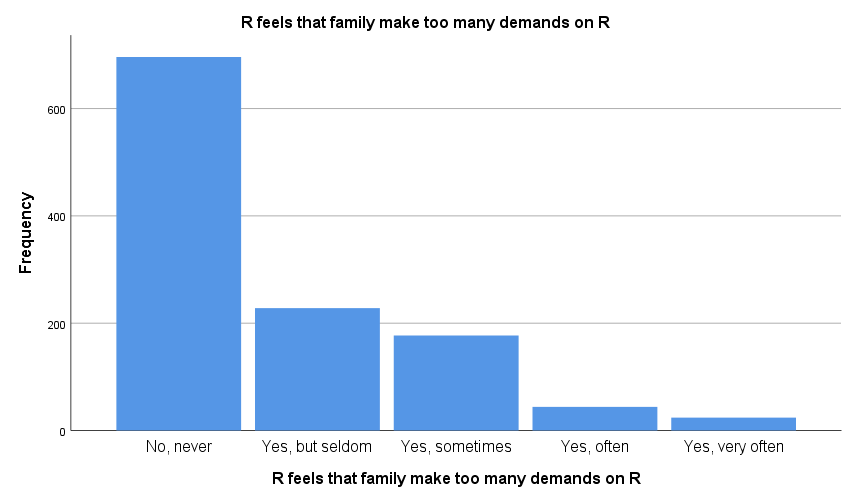
The second survey questions how often a participant experiences too many demands from their family. This researchs answer categories are: no, never; yes, but seldom; yes, sometimes; yes, often; and yes, very often. The total number of answers is 2348, with the percentage of missing data being 50.2. The frequency of answers “no, never” is 696, with a valid percent of 59.5. The response “yes, but seldom” was given by 19.5%, while other categories amounted to 15.1%, 3.8%, and 2.1% respectively. This survey shows that emotional problems are more common than demands ones.
Table 2. Response Frequency Table for Demands Survey
The Measures of Central Tendency and Variables Explanation
The measures of central tendency are mean, median, mode, variance, and standard deviation. To calculate the mentioned rates, for both surveys answer categories were given value number, where “never” is equal to 1, while “very often” is considered as 5. Mean is the average of numbers, obtained by multiplying the number of answers from each category by their values and dividing by their count (Almquist et al., 2019). This rate summarizes surveys results and provides a general understanding of to what extent the considering variable is expressed. For the first experiment, the mean is equal to 2.25, while for the second one this rate amounted to 1.69. The Median is the value in the middle of the list of numbers (Almquist et al., 2019). It can explain to what side of sample data (“never” or “very often”) answers tend to be located. This rate is calculated by picking the middle number after multiplying answers in categories to their values. The first surveys median is 2.00, while for the second experiment this rate is equal to 1.0.
Mode is the most frequently appearing value which directly shows what category of data set includes answers the most. For both experiments, the model is equal to 1. Standard deviation is a square root of the variance, and both rates are measurements, which evaluate the level of deviations on the mean basis (Almquist et al., 2019). The obtained results in both surveys, which are 1106 and 1223, respectively, for the first experiment, and 994 and 989 for the second one, indicate the large dispersion rates. It implies that many surveys answers are different from their means. The mentioned measurements show that in the first experiment, most participants evaluated the frequency of their emotional problems between “rarely” and “sometimes”. The other surveys outcomes are between “no, never” and “yes, but seldom”.
Surveys Outputs Explanation
Both variables show similar results, but frequencies in their tables are different. For the first survey, the numbers of responses “never”, “rarely”, “sometimes”, “often”, and “very often” amounted to 727, 686, 601, 234, and 81, respectively. It shows the prevalence of the first three types of answers and indicates the general tendency among participants to experience some emotional problems. For the second survey, the numbers of responses “no, never”, “yes, but seldom”, “yes, sometimes”, “yes, often”, and “yes, very often” are amounted to 696, 228, 177, 44, and 24, respectively. It shows the prevalence of the first category of answers and indicates the general tendency among participants to not feel that their families make too many demands on them.
Reference
Almquist, Y. B., Kvart, S., Brännström, L. (2019). A practical guide to quantitative methods with SPSS. Research Reports in Public Health Sciences. Web.