Introduction
Stress is any type of change that causes physical, emotional, or psychological strain to people. It is the response your body gives to anything that requires attention or action. Adolescents are vulnerable to the problems associated with academic stress (Reddy et al., 2018). Stress is part of academic life for many students because of several factors some self-made while others extern beyond their controls (Rana et al., 2019). Learners at the basic education are normally stressed by too much homework, a heavy workload, and lack of enough sleep (“Common Cause of School Stress,” 2018). There is also a perceived lack of support, classes that are too hard, changes in the environment, and changes in routines like homework and sleep time. (“Common Cause of School Stress,” 2018). In colleges grading systems, inadequate resources, the vastness of the syllabus, longer learning hours, and the fear of failure in exams cause stress among students (Reddy, 2020). Additionally, families attach a higher value to the academic excellence of students (Lee, 2020). Students are expected to go beyond their limits to excel in academic scores.
Course assessment is another source of student stress in schools, colleges, and universities. High levels of exam stress could reduce the attention the students give to their studies, resulting in them scoring lower grades (Shean, 2019). However, how the learners view the stress may be the difference in its overall impact (Sharma, 2018). Those who are positive that stress arose their level of response; use it as a challenge to perform better in their exams (Shean, 2019). They use it as a motivation to do better in examinations.
Test anxiety arising from factors like poor study habits, and students believing they may not do well, are also key reasons exams stress the students. To some students, the anxiety may be too much that it results in them failing in their tests (Cherry, 2020). Two studies were done on the relationship between stress and students’ academic performance, according to Lin et al. (2020) showed conflicting results. They reported that some studies revealed that students who had higher stress performed poorly and had low grades; while the other study had no correlation between stress and academic performance. The clarity on the role stress play in students’ performance could largely rely on the extent of the stress (Lin et al., 2020). Therefore, a proper understanding of the relationship between stress and students’ course assessment is a key motivation behind this research.
Stress can also be seen as a process by which students perceive and try to cope with threats and challenges. In this case, it is viewed as normal and necessary in helping the students be more active and proactive when preparing and while writing their exams (Alsulami et al., 2018). Students mostly those in colleges are presented with unique challenges of transition from their homes to new environments, and from adolescence age to young adults. This could pose a challenge to many due to complex interactions between them and possible stressors including academic demands, changes in lifestyle, and separating from family (Racic et al., 2017). Further, moving away from home, financial constraints, inadequate living conditions, psychological and emotional issues could also be perceived as sources of stress to students (Racic et al., 2017). Studies have shown that stress among students has a huge can affect their mental health (Hosseinkhani et al., 2020). In addition, the perception of stress among students could lead to anxiety, depression, interpersonal sensitivity, frustrations, and powerlessness (Bedewy & Gabriel, 2015). Against this background, this research paper aimed to investigate the relationship between perceived academic stress, continuing, and returning students variables.
Methodology
This research paper adopted a descriptive correlational design, techniques, and approaches. A correlational study is a type of descriptive research, with two main situations where on one hand the researcher may choose to conduct the research to find out if there is a relationship between two variables. Secondly, if the researcher thinks there is a causal relationship between variables. (Stangor & Walinga, 2019). However, it is inaccurate to perform an experimental study that manipulates one of the variables. Further, just because research finds a correlation between two things does not mean that one of them causes the other. However, although correlation research can’t prove causation, with a large amount of carefully collected and analyzed data, it can strongly support a causal hypothesis.
Participants
Those who participated in this study were students who had completed various levels of their studies or were still learning at different stages and they were 43 in total. They were drawn from many fields of studies like social and political sciences, education, drama, English, English and German, English literature, Education Studies with SEN and Social Inclusion, History and BA Hons Childhood Development and Playwork. Another set of participants was selected from BA Music, BA Neuroscience, BA Philosophy, Politics and Economics, BA Politics, Philosophy and Economics, BA Sociology and Criminology, BA Sociology and Education, and BA Teaching & Education. There were also students from BA Visual Communication, Bachelor of Medicine, Bachelor Pharmacy, BSc Chemistry, BSc Communication and Counselling Studies, BSc Mathematics with Actuarial Science, BSc, and Magister in Engineering. Lastly, there were students studying Masters in Commerce (Management studies), MEd Special Education, MPhil Music Composition, MS Education and Special Education, MSc International Tourism and Hospitality management, PG Diploma, PGCE, and PGCE Primary.
Measures
The survey method is the most common method of collecting data for correlational research. It involves random sampling of the variables or the subjects in the research in which the participants fill a questionnaire centered on the subject of interest (Selian et al., 2020). This technique is very flexible, as the researcher can collect a lot of data within a short time (Katzukov, 2020; Patterson, 2018). Internal consistency and content validity of the instruments was done prior to data collection. However, this method can also be affected by swayed survey questions or the unfairness of participants.
Sampling Procedures
This research adopted a mixture of sampling techniques, to arrive at the most appropriate sample size. First and foremost, the researcher used purposive sampling to select 37 disciplines or fields of studies from which sample respondents who participated in the survey were drawn. This sampling technique relies on the discretion, judgment, and knowledge of the researcher to select the sample of the target population as participants (Stephanie, 2021). Once the fields of studies were identified, the research used simple random sampling to pick one respondent from each discipline. However, there were exceptions in the subject areas of BA Music, BA Education, and PGCE fields that had two, four, and three respondents respectively. This technique was adopted because it gave every member of the field selected for this survey an equal chance of being selected (Thomas, 2020). This sample procedure arrived at a sample size of 43 respondents who participated in the survey by answering the questions.
Data Analysis
Data collected was checked for consistency before entering into SPSS for analysis. Sorting of data necessitated the elimination of incomplete and shoddy answered forms. Data entry into SPSS and, cleaning ensured no missing datasets were carried onto the analysis stage. The analysis was done in two parts, firstly, there was descriptive statistics analysis from which results were presented in terms of frequencies, means, and standard deviations. Correlation analysis was also done to establish the relationship between perceived academic stress, continuing students, and returning students.
Results
The number of females who participated in this survey was 33 which proportionally represented 76.7%, against the males who were 9 (20.9%), while 1 (2.3%) participants remained non-committal on this demographic characteristic. There were also 23 (53.5%) continuing students and 20 (46.5%) returning students who participated in the survey respectively. In terms of educational level, 32 (74.4%) of the participants confirmed having Bachelors’s qualification as their last degree; 5 (11.6%) said they had postgraduate level qualifications, and 6 (14%) were having a master’s level degrees. The mean age of the respondents in this survey was 26.81 ± 5.391; a dispersion of slightly more than 5, shows the respondents’ ages were closer to the center, and no age was extremely skewed.
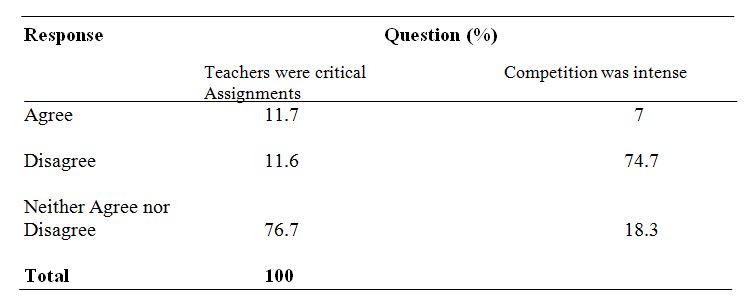
Table 1
Stress Related to Academic Qualification
When asked the question about how critical the teachers were of their assessments, 33 (76.7%) of the participants neither agreed nor disagreed with the question. 5 (11.6%) of the students disagreed with the question while another 5 (11.7%) agreed that their teachers are critical of their assessments. There was a strong disagreement response with 32 (74.4%) of the respondents saying competition with peers was not intense; 8 (18.3%) neither agreed nor disagree, and 3 (7%) said competition with peers was intense.
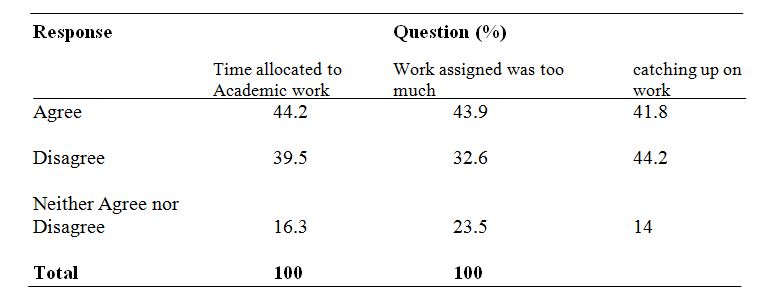
Table 2
Stresses Related to Course Assessments
Time allocated for academic work seemed to the enough according to 19 (44.2%) respondents; 7 (16.3%) of them did not agree or disagree; 17 (39.5%) of the participants said the time for classwork was not enough. When asked whether work assigned to them was too much, 32.6% of the participants disagreed; 23.5% were undecided, and 43.9% agreed that work assigned was too much. On the question about catching up on academic work, 19 (44.2%) disagreed; 6 (14%) neither agreed nor disagreed, and 18 (41.8%) agreed that they were unable to catch up when they are behind in class. The majority of participants, or 55.8%, stated that they had adequate time to unwind before turning in their official assessments; 25.6% disagreed with the question, and 18.5% were unsure.
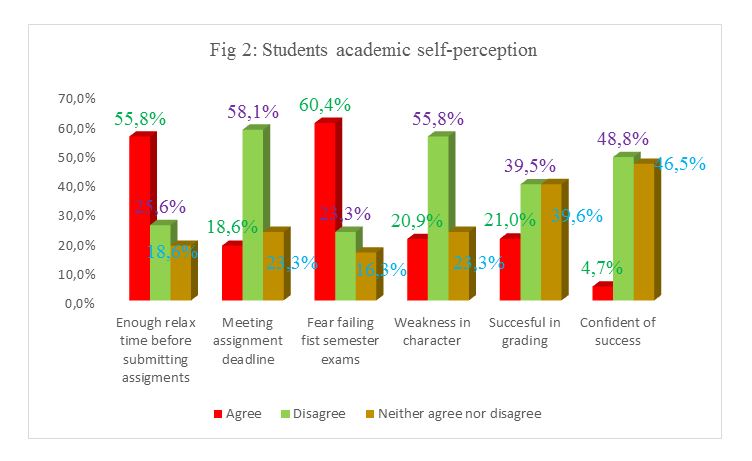
Table 3
Stresses Related to Students’ Academic Self-Perceptions
Participants representing 55.8% said they had enough time to relax before submitting their formal assessments; 25.6% disapproved of the question; while 18.6% of them were undecided on this question. Decisions about meeting assignment deadlines were approved by only 18.6% of the respondents; the majority of the participants’ equivalent to 58.1% disagreed that they prioritize their assessments to meet deadlines; another 23.3% were undecided. Most participants representing 60.4% said they feared failing in any modules in their first semester; 23.3% of them disagreed, and 16.3% remained neutral on the question. Some students 20.9% seemed weak in character and as a result, were worried about examinations; 23.3% neither agreed nor disagreed; however, 55.8% did not think the weakness in character makes them worry about assessments. On the question asking about success in terms of grades, 39.5% were undecided; another 39.5% of the respondents disagreed; however, 21% confirmed that they are confident of success in their grades. Lastly, many participants representing 46.5% neither agreed nor disagreed that they are confident of success in their future careers; another 48.8% of them disagreed, and only 4.7% of the students said they are confident.
Discussion
Bivariate Pearson correlations were conducted between main variables age, years since attaining the last degree, present employment, stress related to academic expectations, course assessments, and students’ academic self-perception. Additionally, another correlation was run to test the association between continuing students and returning students’ variables against stress related to academic expectations, course assessments, and students’ academic self-perception. This statistical test measures the strength and direction of association that exists between two variables measured on at least an interval scale (Isaac & Chekweru, 2018). This test tries to draw a line of best fit through the data of two variables, and the relation coefficient, r, shows how far all data points are from the best fit line. It gives information about the strength and direction of the association.
There was no statistically significant correlation between the two variables, according to the Pearson Product Moment correlation between students’ age and the stress associated with academic expectations. These were the test results: r =.005, n = 43, p =.974. The two variables failed the connection test were compared using a 95% confidence interval and a significance level of 5% (0.05). There was no statistically significant correlation found between the age of students and the stress associated with course assessments. The test’s results showed that (r = -.272, n = 43, p =.078). A 95% CI and a significance level of 5% (0.05) were used to compare the two variables that failed the link test. Furthermore, there was no statistically significant correlation between the two variables in correlational tests comparing students’ age to stressors associated with their academic self-perceptions. Test findings showed that r = -.196, n = 43, and p =.208. When the two variables were compared using a 95% confidence interval and a significance level of 5% (0.05), the connection test was unsuccessful.
The correlational statistics between education level of students last degree against Stresses related to academic expectations was not significant; it had (r = -.074, n = 43, p =.637). Compared upon the confidence interval of 95% and significance level set at 5% (0.05), the two variables failed the relationship test. Likewise, the correlation test between the education level of students’ last degree against stresses related to course assessments was not significant; it had (r = -.183, n = 43, p =.239). Compared to the confidence interval of 95% and significance level set at 5% (0.05), it was evident no relationship existed between the variables.
On the other hand, the correlation between the education level of students’ last degree against stresses related to students’ academic self-perceptions was statistically significant; with (r = -.373*, n = 43, p =.014). The association was a weak negative, meaning when one variable increases, the other one decreases, and vice versa. There were no relationships between Present employment status and either stress related to academic expectations, stress related to course assessment, or stresses related to students’ academic self-perceptions. Additionally, no correlation was established between continuing students’ variable and returning students variable on one hand, against stress related to academic expectations, course assessment, or students’ academic self-perception.
Table 4
The mean difference for perceived sources of stress between continuing and returning students was -.41087 for academic expectations;.23913 for course assessments; and.62174 for students’ academic self-perceptions. However, this difference was not statistically significant with (t (41) = -1.084, p =.342 >.05). Equally, there was no significant difference in perceived sources of stress based on age difference, how long since attaining the last degree, and previous academic backgrounds of the students of this study.
References
Alsulami, S., Omar, Z., Binnwenjim, M. S., Alhamdan, F., Aldress, A., Al-bawardi, A., Alsohim, M., & Alhabeeb, M. (2018). Perception of academic stress among Health Science Preparatory Program students in two Saudi universities. Dovepress. Web.
Bedewy, D., & Gabriel, A. (2015). Examining perception of academic stress and its sources among university students. The perception of academic stress scale. Research Gate. Web.
Cherry, K. (2020). Causes of Test Anxiety and Academic Stress. Verywellmind. Web.
Common Causes of School Stress for Students. (2018). Oxford Learning. Web.
Hosseinkhani, Z., Nedjat, S., Parsaeian, M., Hampa, V. F., & Hassanabadi, H. (2020). Designing and psychometric evaluation of Iranian students ‘academic stress questionnaire. Iran J Public Health, 49 (4). Web.
Isaac, E. O., & Chikweru, A. E. (2018). Test for Significance of Pearson’s Correlation Coefficient. International Journal of Innovative Mathematics, Statistics & Energy Policies 6(1), 11-23. Web.
Katzukov, Y. (2020). What is a descriptive correlational study design? Asking lot. Web.
Lee, K. (2020). High expectations causes high stress for academically driven students. Vow. Web.
Lin, X., Zhang, C., Yang, M., Hsu, M., Cheng, H., Chen, J., & Yu, H. (2020). Stress and its association with academic performance among dental undergraduate students in Fujian, China: a cross-sectional online questionnaire survey. BMC Medical Education. Web.
Patterson, P. D. (2018). Reliability and validity of survey instruments to measure work-related fatigue in the emergency medical services setting: A systematic review. Web.
Racic, M., Todorovic, R., Ivkovic, N., Masic, S., Joksimovic, B., & Kulic, M. (2017). Self-perceived stress in relation to anxiety, depression and health-related quality of health among professions students. US Library of Medicine. Web.
Rana, A., Gulati, R., & Wadhwa, C. (2019). Stress among students: An emerging issue. Research Gate. Web.
Reddy, K. J., Karishmarajanmenon, MS., & Anjanathattil. (2018). Academic stress and its sources among university students. Biomedical & Pharmacology Journal Vol. 11 (1). Web.
Reddy, K., Rajan, K., & Thattil, A. (2018). Academic stress and its sources among university students. Biomedical and Pharmacology Journal. Web.
Selian, S. N., Hutagalung, F. D., & Rosli, N. A. (2020). Academic stress, coping and social cultural adaptation of psychological well-being among Indonesian postgraduate students. Pertanika Journal, 28 (4). Web.
Sharma, S. (2018). Perceived academic stress among students. International Journal of Multidisciplinary, 3 (8).
Shean, M. (2019). Don’t calm down! Exam stress may not be fun but it can help you get better marks. The Conversation. Web.
Stangor, C., & Walinga, J. (2019). Psychologists use descriptive, correlational, and experimental research resigns to understand behaviour. University of Saskatchewan. Web.
Stephanie. (2021). Purposive sampling (Deliberate Sampling). Web.
Thomas, L. (2020). An introduction to simple random sampling. Scribbr. Web.
Appendix
Student Academic Stress Survey
This questionnaire is designed to examine perceptions of academic stress and its sources among Master in Psychology programme.
Research Questions:
- To what extent do perceived sources of stress differ between continuing and returning students?
- Is there a difference in perceived academic stress based on age difference, how long since attaining their last degree and previous academic backgrounds of the students of this study?
Hypotheses:
- We assume that returning students who have completed their last degree more years ago, higher level of academic stress they would perceive when comparing it with the continuing students who might just completed their last degree in recent years.
- Students who have similar academic backgrounds in terms of their highest academic level (e.g., have already attained Master or above degree,) or similar prior knowledge (e.g., previous degrees related to psychology, counselling or education backgrounds) may perceive different sources of academic stress when comparing with other students in the programme.
- There are other sources of academic stress that both returning and continuing students perceived differently.
Questionnaire Sample
Part A: Background Information
Please circle where appropriate
What is your sex?
- Female
- Male
- Other (please specify______________)
- Prefer not to answer
What is your date of birth? (MM/YYYY) ____________________________________________________________________
What is your present relationship status?
- Single
- Dating
- Married
- Divorce
- Other (please specify______________)
- Prefer not to answer
How many children do you have?
- None
- 1
- 2-3
- More than 3
- Prefer not to answer
What is your highest level of education that you have completed? (e.g., BSc in Psychology, BA in Education)
______________________________________________________________________________________
How many years since attaining your last degree?
_______________________________________________________________________________________
What is your present employment status?
- Full-time Student Only
- Student + Part-time Employed
- Student + Self-employed
- Other (please specify______________)
- Prefer not to answer
Are you a Home Student or an International Student?
- Home Student
- International Student
What is your native language or languages?
_____________________________________________________________________________________________
How satisfied are you with the relationship you have with your fellow classmates?
- Very satisfied
- Somewhat satisfied
- Neither satisfied nor dissatisfied
- Somewhat dissatisfied
- Very dissatisfied
How long does it take to commute from your accommodation to the University? (In minutes)
_______________________________________________________________________________________________
How satisfied are you with the time you spend on commuting from your accommodation to the University?
- Very satisfied
- Somewhat satisfied
- Neither satisfied nor dissatisfied
- Somewhat dissatisfied
- Very dissatisfied
Part B: Academic Stress
To what extent do you agree with the following? (Please circle)
Part C
What are the main factors that have caused you stress in your studies? and why?
_______________________________________________________________________________________________
_______________________________________________________________________________________________